Tabulating Model Results or Data
Tables of data from model runs are prepared by the powerful Compare program, so called for its ability to compare data from various runs of a model. However, it also can show data from a single run or from a data bank.
Compare is activated through the Model | Tables on the G7 main menu. Selecting this item brings up a form for preparing input data to Compare.
Compare Window
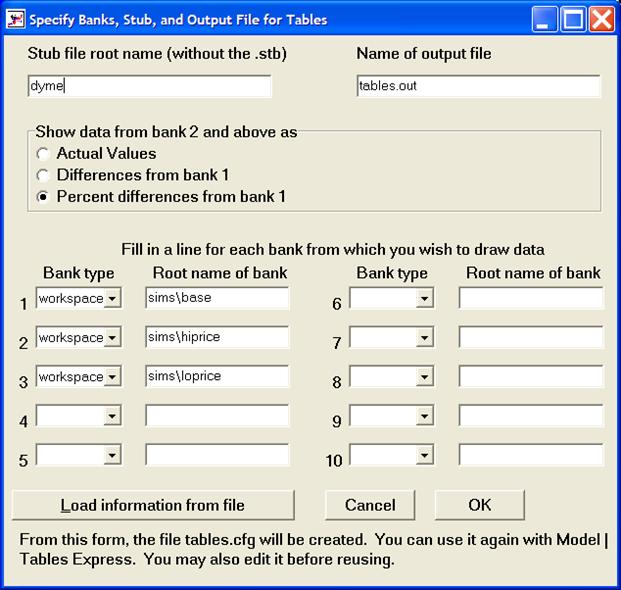
At the top left of the form, you are asked for the name of the stub file. The stub file fundamentally gives the names of the series to be put into the table and the dates to be listed. However, it may contain many commands to Compare, as will be described further below.
At the top right of the form is space for the name of the “output file,” the text file that will be produced as the output of the comparison. An acceptable entry would be HISTSIM.OUT.
Next, you must specify how you want to show data from the alternative banks. The base bank, the first, will always be shown in actual values. The others, however, may be shown as deviations from this base, as percentage deviations from the base, or as actual values. Usually – but not always – the best choice is deviations, so that is the default value.
Then we must enter the types and names of the banks we want to compare. Unless you are using the Interdyme system, the type almost always is “workspace.” InterDyme users also might have Vam banks. To compare a historical simulation bank, “histsim”, against actual values in a bws bank, put “bws” in the name field for the first bank and “histsim” in the name field for the second bank. Then click OK.
Compare is a console application program; it will run in a command prompt window. Normally, there is nothing to do except tap any key when the program has finished. However, if Compare finds fault with your commands, it will let you know in this window, so look for messages before blithely tapping a key.
Note that the configuration that you specify in the Tables window will be saved to file as COMPARE.CFG. This configuration will load automatically the next time that you open the Tables window. You may load an alternative configuration from file by selecting the “Load information from file” button. Note too that G7 will create a file called TABLEX.BAT, if it does not exist, when you click OK. This batch file is executed by G7, and the Compare program is run by way of a command in the batch file. If the TABLEX.BAT file already exists, G7 simply will run it. You thus may edit the TABLEX.BAT file to add additional DOS commands or to modify the path to the COMPARE.EXE program.
When Compare has finished and the window has closed, look at the output file, HISTSIM.OUT in our example, with the editor. Be sure that the editor is using a monospaced font, such as Courier, Line Printer, or Fixedsys; otherwise, the columns of numbers might not line up vertically. Now let us look at a stub file. Here is AMI.STB:
\\dates 1980 1982 1986 1988 1990 1992 1994 1996 1998
\\under = \\7 1 65 2 2 45
;
&
gdpR ;Real Gross domestic product
cR ; Personal consumption
vR ; Gross private domestic investment
vfR ; Fixed investment
viR ; Inventory change
feR ; Exports
fiR ; Imports
gR ; Government purchaes
;
gdpD ;GDP Deflator
gdp ;Gross domestic product
pibg ; Personal Income before gov
indtax ; - Indirect taxes ptax ; - Personal taxes
ngtpp ; + Gov transfers to persons
pidis ; = Personal disposable income
piipcb ; - Interest paid by consumers
pipttf ; - Transfers to foreigners
c ; - Personal consumption expenditure
pisav ; = Personal saving
The commands beginning with a “\” are commands to Compare. The first one sets the dates for the data to be shown. A date like 1990 is an annual date, and Compare will take an annual average of the quarterly data in our model. We also could give a quarterly date like 1990.2. If we include intervals in the dates, like 1990-1995, Compare will show the growth rate over that period. The growth rates will be calculated with continuous compounding. (Other compounding specifications are available, but they generally are inferior to the default.) The “\under” command just sets the character that will be used for underling in the table.
The “\” command by itself, as in the third line, sets the following parameters:
- fw:
field width of the numbers in the table
- dp:
decimal places to be show in the table
- pl:
page length, in lines
- tm:
top margin, in lines
- bm:
bottom margin, in lines
- tw:
width of the titles on the left side of the page.
An “&” at the beginning of a line causes the dates to be written across the page and underlined with the underline character. A line with a “*” in the first position forces a new page. The other lines, that is to say, most lines, have variable or expression on the left followed by a ‘;’ followed by a title. The title will appear at the left of the page and the value of the expression will be shown in the columns under the appropriate dates.
There are many other Compare commands. You also may wish to read the documentation in COMPARE.PDF. Additional details are available elsewhere in the Help files.
