Using Compare to Make Tables
Compare is a program that works with G7 databanks to create tables for printing, or for creating nicely labeled spreadsheets, or producing tables in other formats. You can create your own table definition files (called stub files) to develop a tables and reports of your own design.
In a typical Compare table, the values in each column coincide with a given dates or ranges of dates. Rows of the table display data for a given variable or expression involving matrices, vectors, or macrovariables, with an optional title. Compare reads a stub file to learn the desired structure and format for the table, which the user defines. Compare reads the data series from one or more databanks.
A stub file consists of a list of commands or variables, one per line. The next example is of a small table stub file, which will print a summary of federal receipts, spending, and the surplus. It show some of the rules for creating a valid line.
Comments follow a hash sign (#) and may be included anywhere in the file.
Most Compare commands begin with a backslash (\), which is a required part of the command. Commands are available for table formatting, doing data transformations, and other tasks.
To include a variable in the table, type the variable name or expression, followed by a semicolon, followed by the title or label for that series.
A \dates command indicates the set of periods or growth rates that will define the columns of the table. The \dates command in the example tells the program to print quarterly data columns from the first quarter of 2005 to the third quarter of 2006, and then to show 2005 and 2006 annual averages (using only the three quarters available for 2006).
The & command prints the current dates as a line in the table.
A * causes the table to move to the next page.
The \announce tells Compare to print the text following the command to the screen to tell users what table is being created.
The \ti command creates the title that is printed on the top of the table.
The other lines in the sample stub file are the names of the variables for which Compare will print data, and a label that will appear next to the data in the completed table.
Sample Stub File:
# FEDSMALL.STB - This is a simplified version of the
# Federal table, to illustrate features of Compare.
\dates 05.1 05.2 05.3 05.4 06.1 06.2 06.3 05 06
\announce FEDERAL GOVERNMENT RECEIPTS & EXPENDITURES
\ti FEDERAL GOVERNMENT RECEIPTS & EXPENDITURES
*
&
g0201   ; CURRENT RECEIPTS
        ;
g0202   ;  Current tax receipts
g0211   ;  Contributions for social insurance
g0212   ;  Income receipts on assets
g0215   ;  Current transfer receipts
g0218   ;  Current surplus of government enterprises
        ;
g0219   ; CURRENT EXPENDITURES
        ;
g0220   ;  Consumption expenditures
g0221   ;  Current transfer payments
g0228   ;  Interest payments
g0231   ;  Subsidies
g0232   ;  Less: Wage accruals less disbursements
g0233   ;  Net federal government saving
Once the stub file is complete and saved, you can run the Compare program to create the table. To run Compare, select Model | Tables item from the G7 menu. For the FEDSMALL.STB table above, we fill in the form as follows:
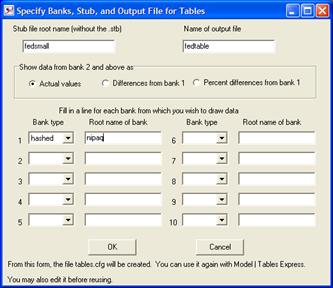
The Compare Window
The name of the stub file is FEDSMALL (without the “.STB” extension), and the name of the output table will be “fedtable”. The radio buttons in the middle (“Show data from bank 2 and above as”) only apply when you are comparing data from two or more banks, so it does not matter which button is pressed, but we select the first “Actual values”. The grid at the bottom allows the user to specify up to 10 alternative banks (usually model simulations) to be compared. Each has a drop-down box, “Bank type”, and a place to type the root name of the bank (without its file extension). In our case, the bank type is “hashed” and the bank name is “nipaq”. Click the OK button, and you should see the following window appear on your screen:
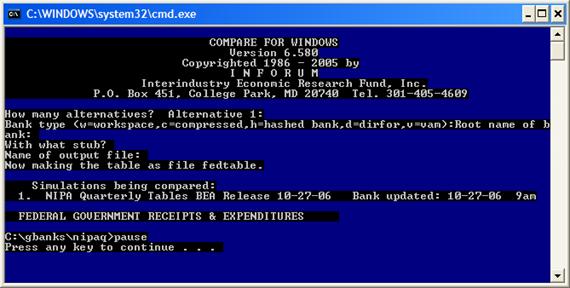
Running Compare
This window is a command window that shows Compare running and creating the table “fedtable”. Hit a key to continue, and the Federal government receipts and expenditures table will be created. The table can be viewed in the G7 editor by typing “ed fedtable”. The table below was copied and pasted from the editor.
Sample Output Table from Compare:
                    FEDERAL GOVERNMENT RECEIPTS & EXPENDITURES

                                2005.1 2005.2 2005.3 2005.4 2006.1 2006.2 2006.3    2005   2006
CURRENT RECEIPTS                2214.5 2240.3 2182.4 2349.8 2490.9 2554.7   -0.0  2246.8 2522.8

 Current tax receipts           1328.0 1344.3 1364.2 1428.4 1524.9 1570.7   -0.0  1366.2 1547.8
 Contributions for social insur  838.3  846.1  863.2  873.8  911.9  928.1  938.1   855.3  926.0
 Income receipts on assets        22.8   23.8   22.8   22.3   23.3   24.2   25.1    22.9   24.2
 Current transfer receipts        29.1   30.5  -61.7   30.6   32.2   32.8   33.6     7.1   32.9
 Current surplus of government    -3.7   -4.5   -6.0   -5.4   -1.4   -1.1   -1.5    -4.9   -1.3

CURRENT EXPENDITURES            2502.0 2529.9 2578.5 2613.3 2637.9 2686.2 2732.1  2555.9 2685.4

 Consumption expenditures        758.0  760.8  784.3  771.1  803.6  802.3  808.9   768.5  804.9
 Current transfer payments      1461.2 1461.8 1481.3 1502.4 1522.0 1546.6 1566.7  1476.7 1545.1
 Interest payments               230.9  252.1  255.2  277.1  257.5  285.4  304.9   253.8  282.6
 Subsidies                        51.9   55.2   57.7   62.7   54.7   51.9   51.6    56.9   52.7
 Less: Wage accruals less disbu    0.0    0.0    0.0    0.0    0.0    0.0    0.0     0.0    0.0
 Net federal government saving  -287.6 -289.6 -396.0 -263.6 -147.0 -131.5   -0.0  -309.2 -139.2
Printing Tables Created With Compare
Compare creates nicely formatted tables in two basic formats: a text format and a worksheet (spreadsheet) format. The procedures for printing these two types of formats are different and the precise instructions will depend on your individual circumstances. The following steps usually will allow you to print useful tables.
Printing Text Format Tables The procedures for printing text format tables depend on whether or not you can print directly from DOS. If you are on a network, check with you network administrator to find the name of the command that will allow you to print files directly from DOS to your network printer. If your system has such a command, then simply execute that command, referring to the file you created from running Compare. For example, if your network DOS print command were called netprint you might type
netprint table.out
If you cannot print directly to your network printer using DOS, we suggest importing the output from Compare into your favorite word processor. If you choose this route, then you also must change the font of the tables to a fixed-width font, like Courier or Line Printer, to preserve the table formatting. You also should choose an 8 or 9-point font.
Further, you also may need to check that the page breaks divide the individual tables in suitable places. If they do not, then changing the top and bottom margins often will allow the tables to print nicely. Some word processors have an auto-fit option that automatically will adjust the size of the tables to fit on the page.
Here are some suggested instructions for Word:
Choose File | Open from the menu and select your file.
Choose Edit | Select All (or hit CRTL+A).
Choose the Line Printer or Courier font in the font selection box.
To preview the document, choose File | Print Preview.
If you choose to import the text tables into a word processor, be sure that the \noformat option is turned on the stub file. That option controls the printing characteristics for DOS printing, but it might interfere with the formatting when a word processor is used.
Printing Spreadsheet Format Tables If you choose the spreadsheet format by putting the command \xls or \wk1 near the top of your stub file, then the output will go into an .XLS or .WK1 file, which can be read by your spreadsheet program. However, you also should preview your spreadsheets to see that they are formatted nicely.
